Research Update - Week 19
YSOLab
Creating Thumbnail Images
One of the smaller tasks I accomplished this week was generating a set of images of each of the sources in our set. These images were created from the (very large) SESNA field image. I have an existing script that I wrote several months ago which automatically generates these images from the given source positions and image, which I was able to quickly re-use to generate a set of images for every source we are currently examining.
The main reason we want these images in the first place is to verify that there doesn’t exist any physical weirdness to a source that would have affected the photometry. This wierdness could mean being in close proximity to a bright source, or being a binary, with either case being likely to cause instability in the light curves.
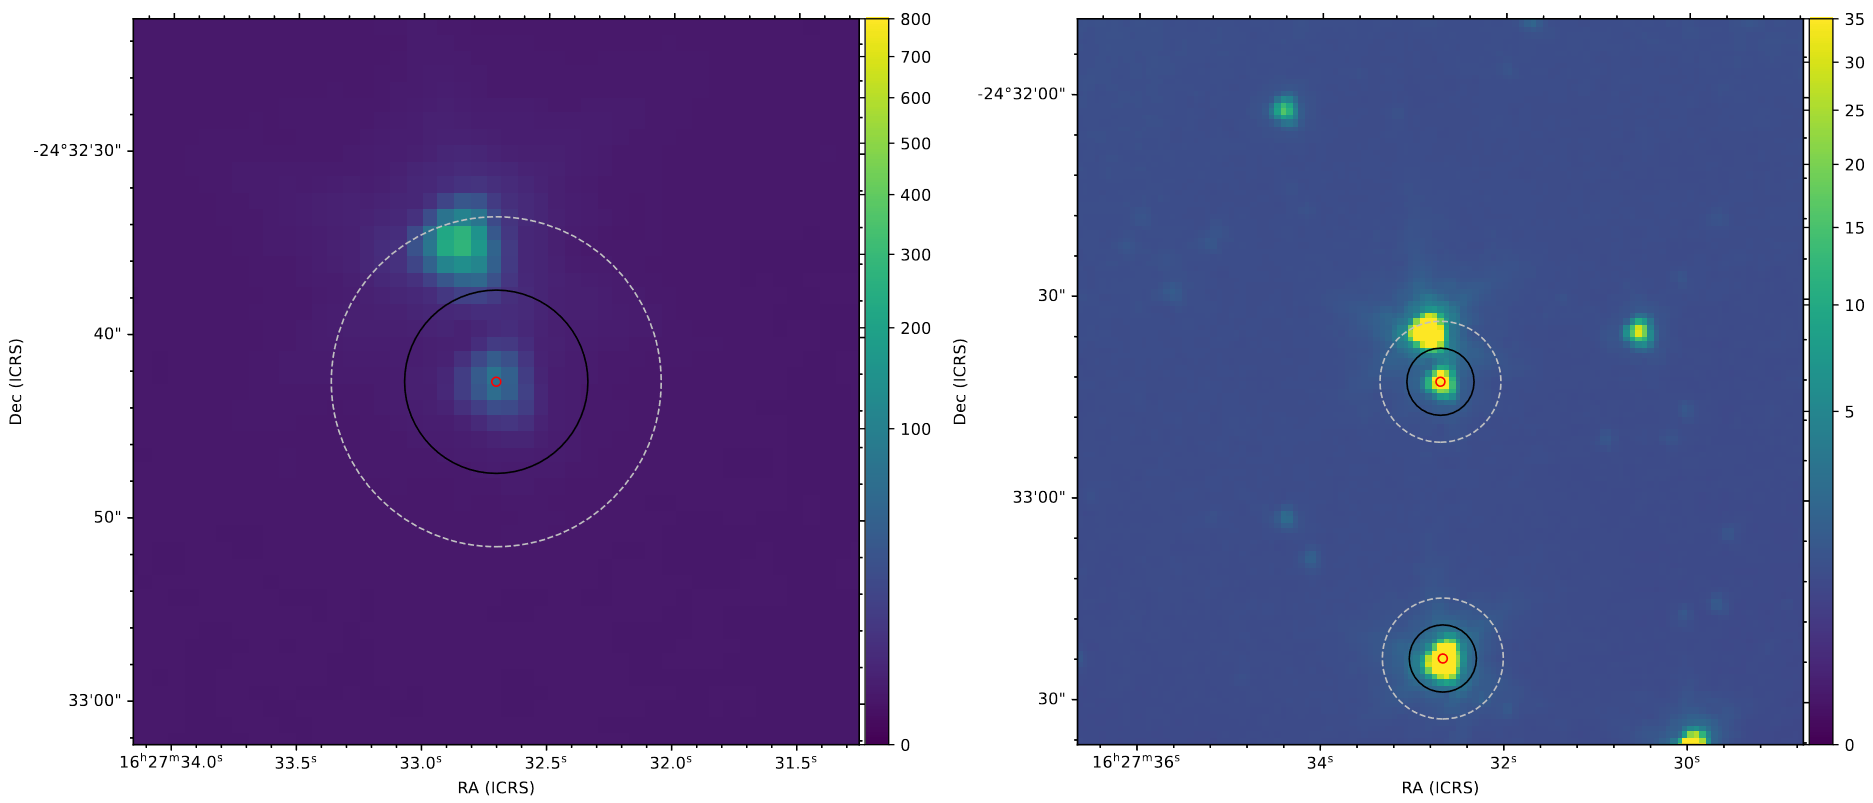 Images showing one of our sources that is very close to another, and as such would likely have unreliable photometry.
Examining Sources for Variability
The main task I worked on this week was going through my assigned sources, and trying to identify the bursts based on their light curves. At our last meeting, we had split the sources amongst the 4 undergrads on the project, after we had filtered for sources with a large variability range.
Any source we found that we suspected might have been a burst, or some sort of variability, was copied to a separate sheet within the main spreadsheet, where we are now keeping track of the bursts that we are interested in.
During this week’s meeting, we went over each of the sources our group found, and Dr. Megeath helped us come to a conclusion on whether it was a burst, a fade, some kind of fluctuator, or if we needed to reexamine the data to confirm if the source was a burst.
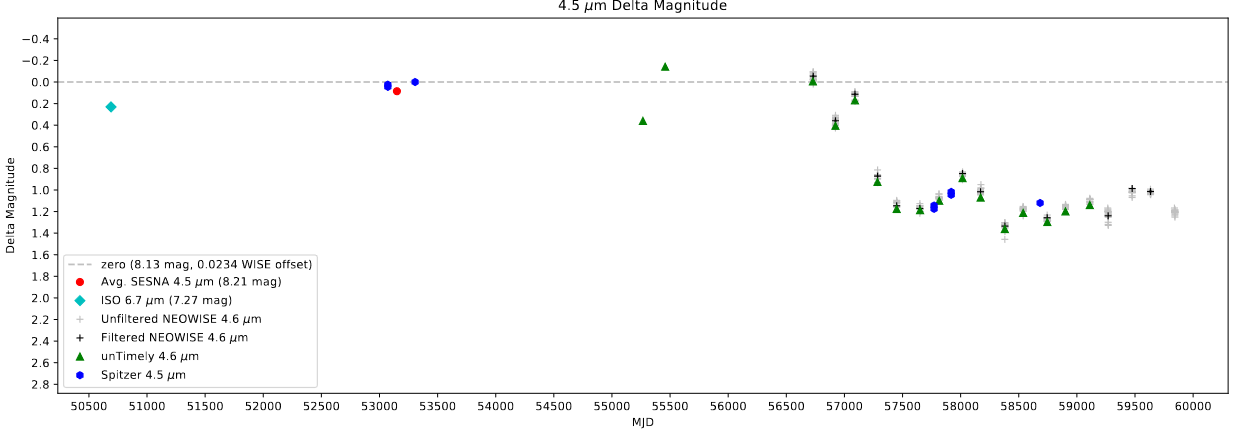 A light curve showing what we have been calling a “Fade”, which resembles the back end of a burst.
Future Work
For next week, there are a few additional sources I plan on re-evaluating, based on the feedback from our meeting. If I receive the new ISO set as well, I can update our sources with the improved photometry, and add a few additional sources to our set.
Cosmology Research Group
Re-Tuning the Visbal 2020 Model
One of the main things I worked on this week was fixing an issue we identified in the original Visbal 2020 model. Several months ago, we discovered that our selected renaissance region intersected with a lower-resolution region, which necessitated that we produce a new version of the extracted Renaissance halos, which was shifted to exclude this region.
However, when I was running the original version of the Visbal 2020 model, I forgot to swap to this new halo set, which resulted in the produced ionization cube performing very strangely on many of the graphs.
After resolving this, the results make much more sense, and served as the impetus for the next section.
Determination on Included Models
After fixing the lingering issues with the original Visbal 2020 model, it became clear that there was, really, no functionally significant difference between the results of the original version and the modified version, when compared on the graphs we are interested in.
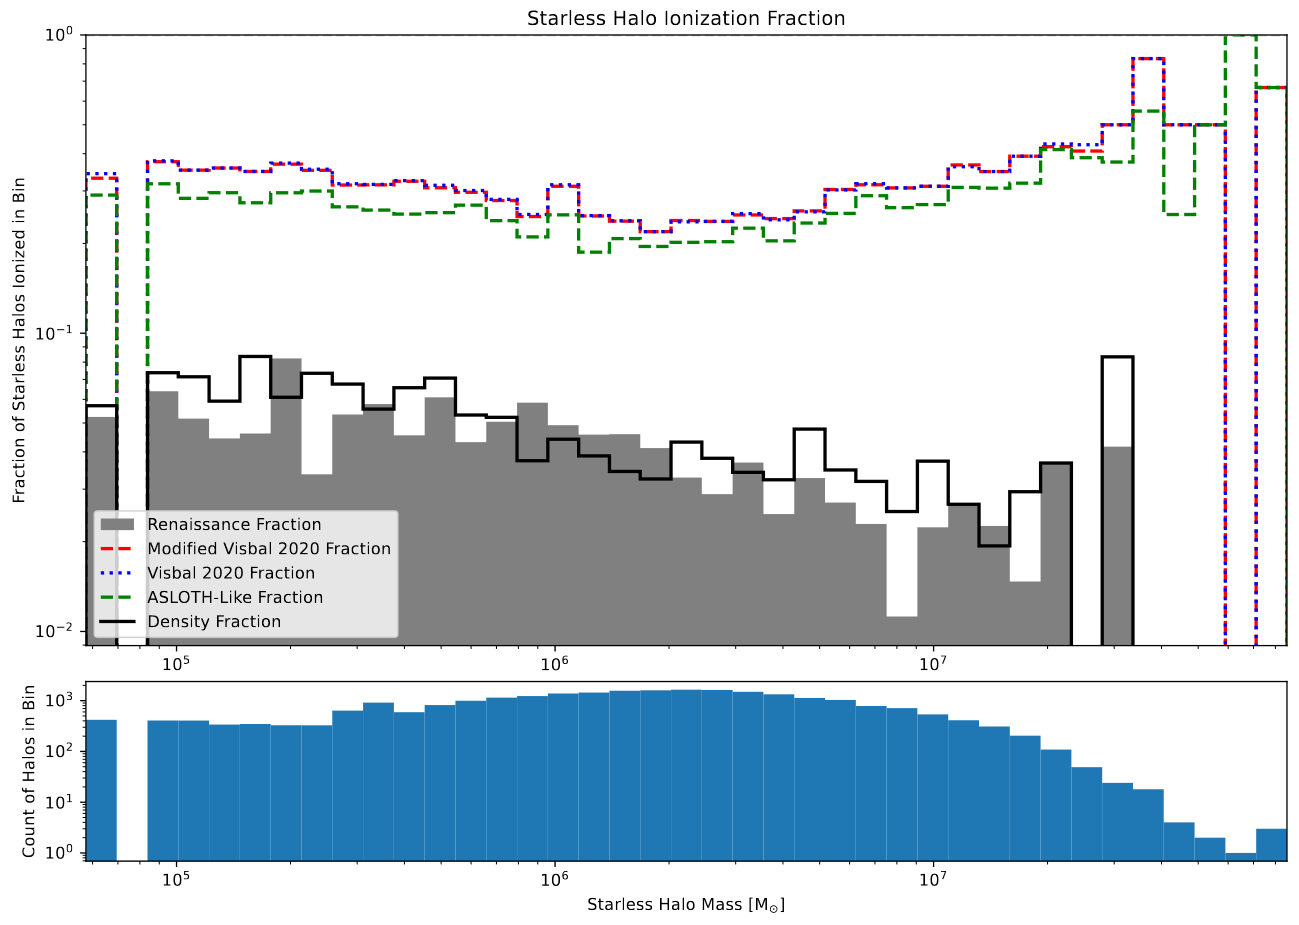 Plot showing the ionization of starless halos, with the focus being the nearly identical Visbal 2020 and Modified Visbal 2020 lines.
This isn’t really that surprising, as many of the tweaks I performed were fairly minor, and were focused more on the shape of bubbles, and didn’t address the underlying weaknesses of the model that cause it to perform poorly on certain graphs.
As a result of this, we decided to only include the original version of the model in the paper, and mention briefly the tweaks we performed, and their lack of efficacy.
Outlining the Paper
Our main task during the meeting this week was to work together on outlining the paper within a google document, with the goal being to continue to refine this outline with more and more detail, until we are happy with the structure and flow, at which point I will start to write in the actual document.
Future Work
For next week, my plan is to work on outlining the methods section of the paper with sentence-level detail.
Gun Violence Archive Analysis
Loading the FBI Data
My main goal this week was to take a look at loading in the FBI data. I began with the already extracted ICPSR data, which was fairly easy to load in. The only wrinkle was that it was in a .dta STATA file, which I needed to use the pyreadstat package to read into python. Otherwise, it was fairly simple.
The other, more complicated goal was to try and load in the data directly from the provided file. The problem being that, unfortunately, the files are structured in a fixed-width, hierarchical format, with each row having 12 months of data across many columns.
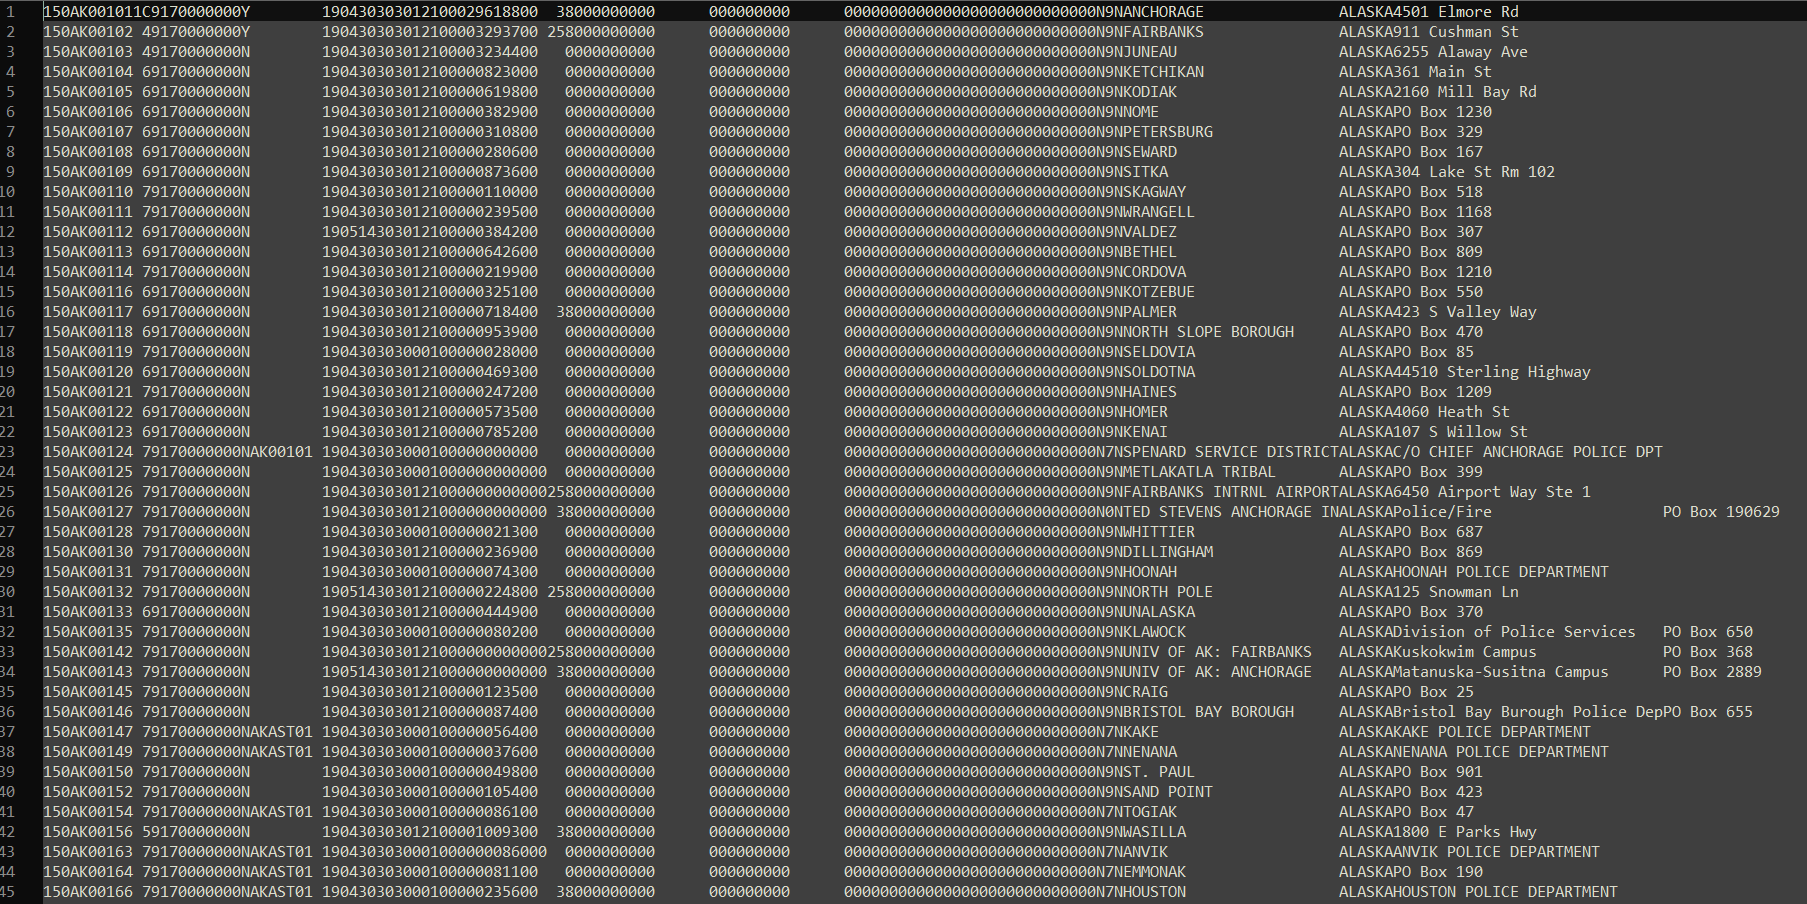 an excerpt from the larger RETA FBI data file I have been working with.
My current plan is to leverage the given key file, which has the name/purpose of each column, as well as the column’s length and datatype, to iterate through each row of the dataframe and add the data to one large dataframe.
I have some code that can do this, however between the iteration, and the large dataframe involved, extracting data from one file (representing one year) takes about 7 hours to do. I can probably leverage a few tricks to try and reduce this time, but I might need to rethink the problem if I want to squeeze any significant performance improvements out of this method.
I have also been experimenting with pivoting the dataframe, so that each month has its own row, rather than each agency having its full year of data in a single row. I have code that should be working, however I have been running into memory problems, as the dataframes involved are getting quite large.
Future Work
For next week, my plan is to keep picking away at opening this data file. Instead of trying to have monthly data, I am going to try aggregating the data to the year level. This has the benefit that it will eliminate the need for me to pivot this data, and will likely be easier overall, both effort-wise and memory-wise.
This is a justifiable simplification, in my mind, because the datasets I have been working with on this project are overwhelmingly structured at the county-year level, so having the data at a more granular level (agency-month) might be nice, but is ultimately unnecessary.
Cluster Research Pod
Examining Background Slices
One of the things I worked on this week was putting together a way of verifying our background annuli sizes. To do this, I wanted to compare the measured background amount against the actual value of the image at that location.
I started by taking a horizontal slice 7 pixels across along the middle of the galaxy in one of the JWST images. I then take the median along the short edge of this slice, so I get the approximate brightness of the background along this slice of the galaxy. I then run the aperture photometry function I have on this image, and plot the brightness of the clusters that fall along this slice, as shown below.
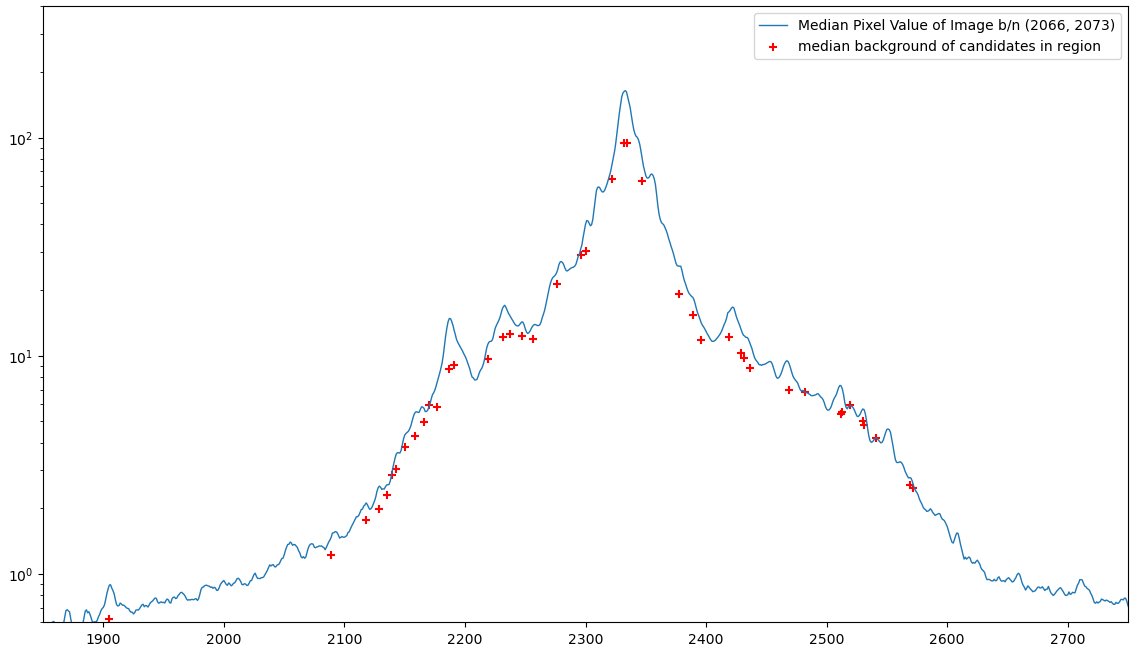 A plot showing the median brightness along a slice of the galaxy, with the median background of the clusters in that slice plotted as red points.
The main takeaway is that, for our current background selection, most clusters have the correct level of background, with clusters in the very center of the galaxy recieving less than the actual amount of background brightness, likely because the annulus is grabbing the region outside of the central core region.
Preparing for Collaborator Meeting
We spent our meeting this week preparing for a meeting with our collaborator on this project, who we will be meeting next week for about an hour. Since we have a limited amount of time to work with him, we wanted to have our questions, problems, and setup all documented and ready to go, as well as send an email containing some relevant information beforehand.
This included selecting a few clusters from the HST image, and looking at their SEDs, and trying to match our expectations to what we are seeing from the images.
Future Work
The upcoming meeting with our collaborator should help us iron out the problems in our photometry code, and will hopefully allow us to continue forward with the project.