Research Update - Week 2
YSOLab
Results of First YSOLab Meeting
YSOLab had its first weekly meeting last friday, in which we discussed our current progress, and spent some time figuring out our best path forwards.
One of our top priorities is finishing up the research note that Dr. Megeath and Chinmay Kulkarni have been working on over the summer. The note focuses on a specific variable protostar, which we have assembled a light curve for by combining several different sources. Currently their focus is on tightening up what was currently written, and condensing the current text to fit within the very restrictive word count mandated by the research note format.
We also were made aware of a mistake made during the calibration of the 2017 Spitzer data provided to us; the overall result of this error is a change of about 0.1 magnitudes in either direction across the measurements. Work is being done to correct this, and once we get the corrected data I can work to re-extract the data from the new IDL save file, and re-integrate it with our existing process.
One other topic was the Spitzer Heritage Archive, which could contain additional data on the sources we area currently interested. The data from that archive we are most interested in currently is the sub-array data, which would be available in the form of images, where each measurement is a stack of 32 images taken very close together, which could be summed together.
Future Work
My main focus over the next week will be to experiment with the Spitzer Heritage Archive, to see if I can replicate the automatic downloading I achieved for the IRSA database.
Following the success or failure of this, I will need to perform the photometry necessary to acquire a magnitude measurement from these images. I have yet to ever actually do photometry, however I have been pointed to a ‘photutils’ package, and will spend some time experimenting, with a focus on learning basic terminology so that I can ask more directed questions to a subject matter expert during our next YSOLab meeting.
Cosmology Group
Halo Slice Plot Improvements
My focus this week has been integrating the semi-analytic model output into these plots. This was successful, and the newly created plots include both a contour plot of the model through each cubical slice alongside the other data, as well as several line contours over-plotted on the renaissance data, outlining the location of the model output.
This was also accompanied with a new weighting format for the renaissance ionization data, where the cubical slice is first multiplied by a cube of weights, which biases the data towards the middle-most layer, and diminishes the values in the cube more as they are further from the middle. This was implemented, and seems to improve the visualization, and helps to more clearly focus the plots on the location of the halo in question (the center of the slice).
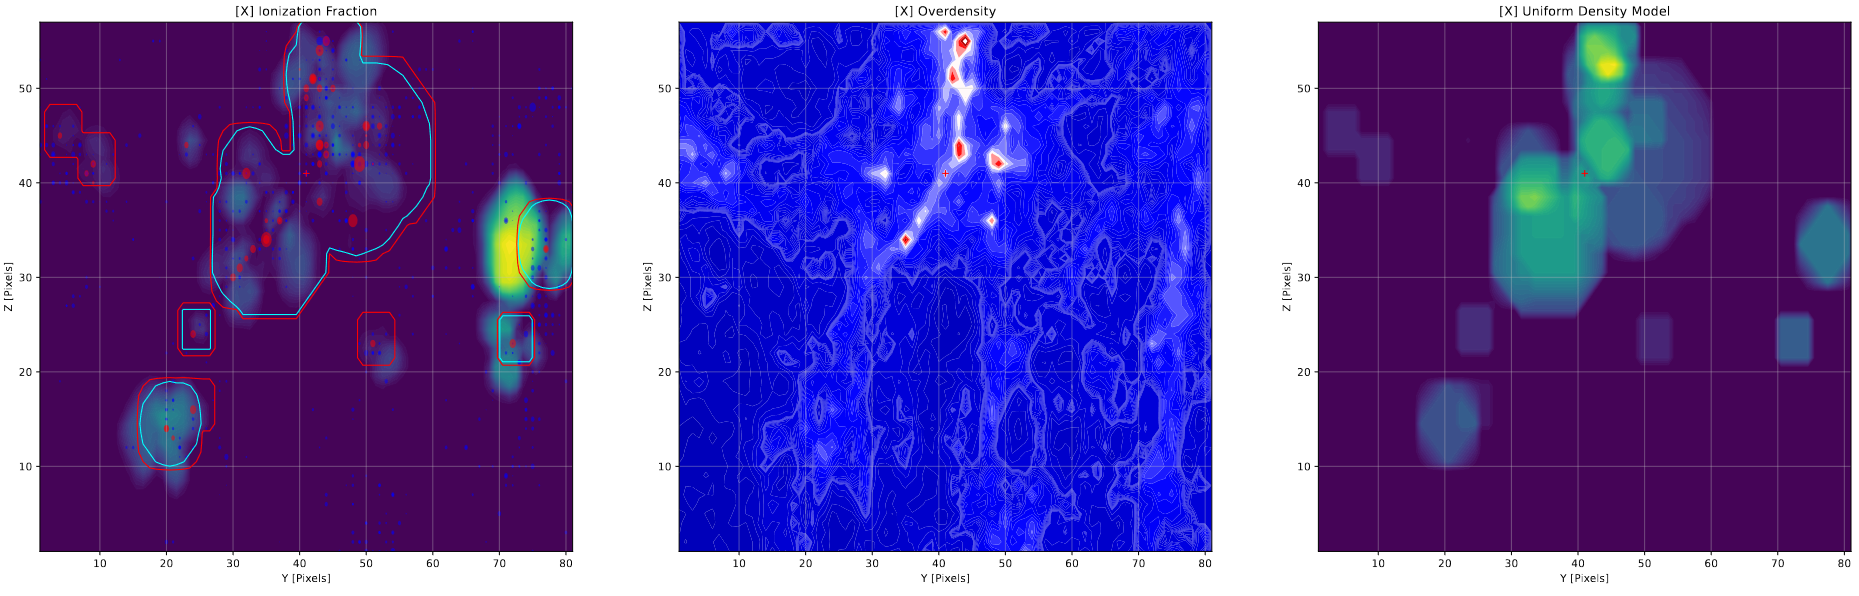 Example of a contour plot along the x-axis surrounding a specific halo. The red outline shows any location where the model has ionization, while the blue shows any location with a value above 1.5 when a weighted sum of the model was taken.
Future Work
My focus for the next week is on trying to better understand these plots. One method we will work on is a way to verify the calculations being done; This will likely manifest as a set of back-of-the-envelope calculations on the expected bubble radius that a halo will form, compared with the results of the model.