Research Update - Week 21
This week did not have much to write about, as I ended up fairly busy with front-loaded coursework ahead of a trip I took later in the week.
YSOLab
Adjustments to Concurrency Criteria
I have previously described the system we use to determine and apply an offset to account for the difference in the filter set used between the Spitzer and WISE telescopes.
Somewhat recently, we switched from applying a single offset to every object to calculating an offset individually for each object. This week, I worked on addressing a few lingering issues and changes that we wanted to maker to this process.
The first adjustment was to expand what data was used to calculate the offsets. Previously, we had been only using the unTimely data to determine this offset. I reowrked this section to also include the NEOWISE data, and to substitute in that data instead if it is closer for the selected Spitzer point.
The other adjustment I made was to address an edge case that could occur, where there was only one unTimely point present for that object. Previously, the program would only calculate an offset for each point if there was an unTimely point on both sides (in terms of date). Instead, if there is only an unTimely point before the Spitzer point, the offset is calculated from that unTimely point’s magnitude.
Future Work
For next week, my goal is to spent a little time adjusting the font sizing on the output light curves, as the text is a little small when they are pasted in the LaTEX document.
In addition, I will endeavor to write summaries for a few of the identified bursts, as I had intially planned to do this week.
Cosmology Group
I spent most of my time on this project this week writing up a rough draft of the Methods and Results sections, which have now been passed off to the other group members for some advice and pointers.
Collecting Data For Graphs
While working on the draft, I started inserting the graphs I had planned on using, only to realize that their fonts and general sizing were not going to work. I spent some time adjusting font sizing and spacing, and got the graphs in a more effective place.
One of the graphs turned out to be a bit trickier. Last semester I constructed a relatively simple class-based slice plotter, which allowed me to quickly create ‘halo-slice’ plots from a set of model data. This class has proven very useful for quickly creating these plots, however the relative inflexibility of the setup means that it became basically impossible to tweak the plots significantly without essentially ripping the whole thing up and rewriting large portions from scratch.
Rather than struggle with the class, I added some small functionality to output the slice data and bounds it uses, which I can then manually plot, giving me much more control of the results.
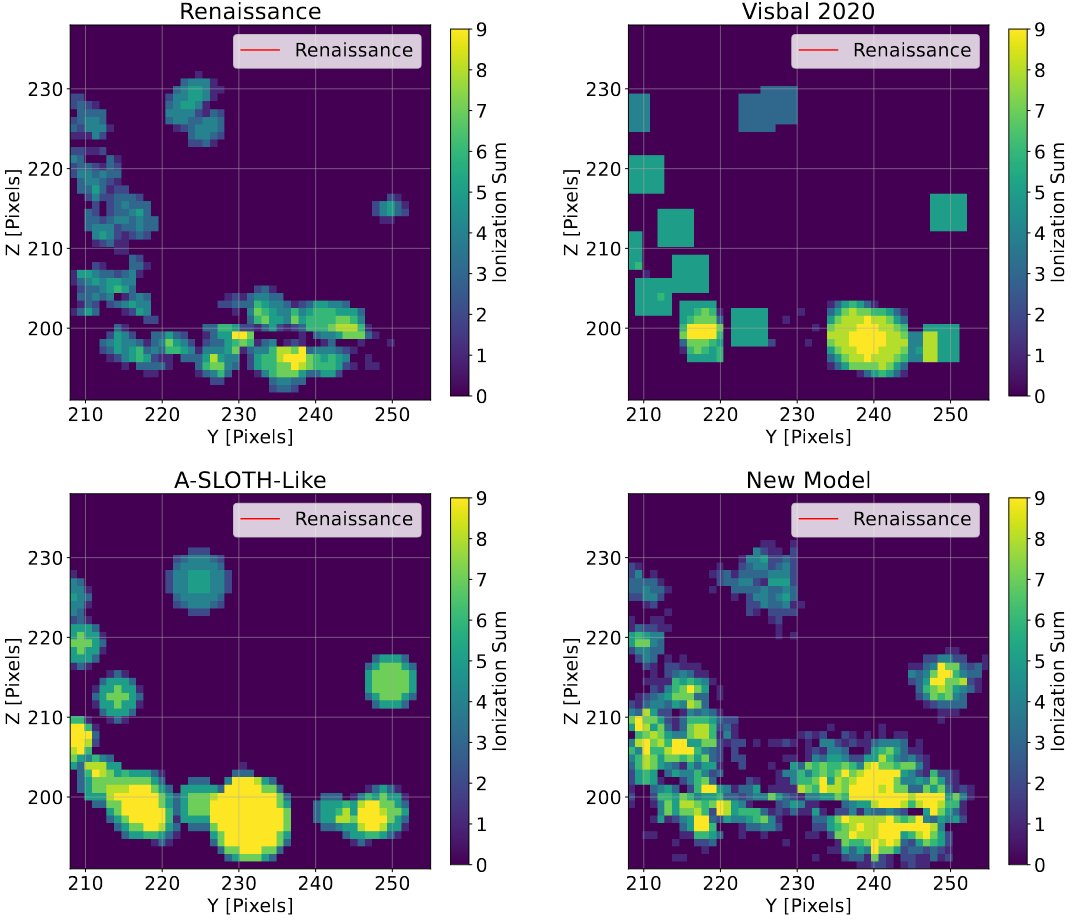 The graph I have previously described.
Future Work
For next week, I plan to do an editing pass on the rough draft I have written, and collect feedback from the other group members.
Gun Violence Archive Analysis
(Still) Reading RETA Data
I am still working on reading in the RETA data, however I am very close to finally finishing this project. I am currently applying the process I have to each of the files in the set.
One silly thing that came up is that each of the RETA files I have been provided are named with a different format. For context, I added the year to the front as a way of consistently labelling the files, but otherwise the filenames are the same as when I unzipped them.
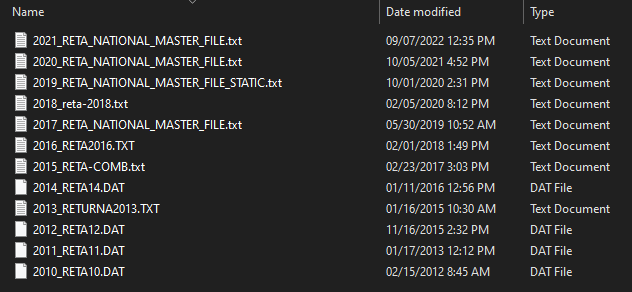 The RETA files, with the point of interest being that each one has a different name.