Research Update - Week 22
YSOLab
Discussion on Classification
We spent most of our meeting time this week having a long discussion about how we should go about classifying the different bursts we have been observing. Our main concern is that, for any given source, we are simultaneously hamstrung by a lack of consistent data over long periods, as well as the fact that multiple different properties within a light curve can arise from different sources.
We honestly didn’t really land on anything concrete, although we did identify a few different papers that discussed similar problems, and we came up with a short list of ideas to try before next meeting.
Future Work
For next week, my primary goal will be finally integrating the updated set of ISO data, as Chinmay has finished re-reducing the photometry. Hopefully, this improved data will help us narrow things down.
I have a feeling that next week is going to be monsterously busy, but if I find some time, I would like to try implementing a few different ideas we had on methods for quantifying the variability and properties of different light curves. Hopefully, at least a few of these methods can help us better classify these curves.
Gun Violence Archive Analysis
Finishing out the RETURN-A File
After catching a silly mistake last week, I am finally, genuinely finished with the RETURN-A FBI data. I have extracted the data from each of the files, and we also managed to find where the data is now stored on the FBI website, so it will be easier to update in the future.
A quick comparison with the ICPSR reduction of the same data shows that our counts are either identical, or within 1 or 2, for more than 95% of agencies, with the remaining errors not being much larger.
Cluster Research Pod
Identifying JWST-Exclusive Clusters
The main thing I worked on this week was looking through our candidate JWST clusters for any that are not represented within the HST clusters.
Setting Up Comparison Images
To make this process easier, I spent some time putting together a function that can take in a desired position and dimensions, and returns a two panel figure containing the JWST and HST images compared. There is also some additional logic to adjust the normalization to the specified subset, and to plot our current set of JWST and HST clusters on both images.
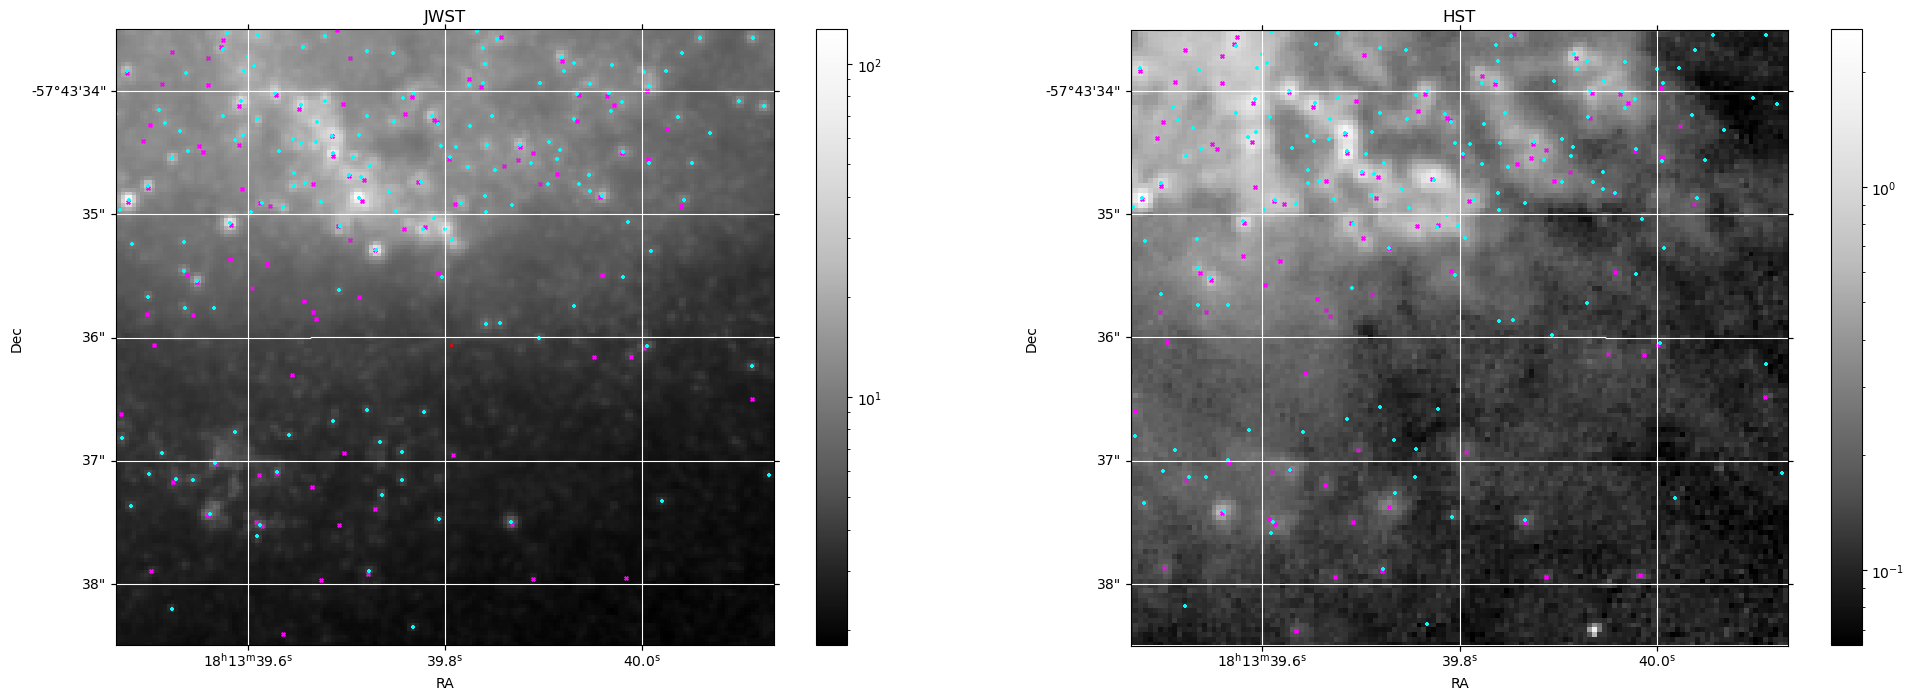 An example of the described plot, comparing a section of the JWST image with the HST image. Cyan points are JWST clusters, and purple points are HST clusters.
The resulting function uses the WCSAxes module from astropy, and works well, with the caveat that it takes close to a minute to actually generate the image. This seems to be a limitation of the WCSAxes module itself, as I observed a similar level of slowdown when using the package aplpy, which explicitly states that it functions as a wrapper for WCSAxes.
HST-Exclusive Clusters
As an aside, one interesting thing we have identified is a number of previously detected ‘clusters’ in HST that are not present in the JWST set. This appears to primarily occur in situations where dust extinction has occluded a space, and a small amount of background light leaks through, appearing as a point source that is picked up by the cluster detection algorithm.
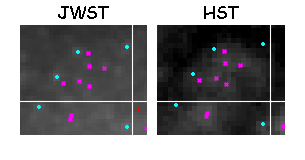 An example of one case where we see clusters in HST that are not present in JWST.
Criteria
To narrow my search, I decided to set a somewhat arbitrary distance threshold, where I used the open3D package to quickly find the distance to the closest HST cluster from every JWST cluster, and removed any that wer somewhat close to an HST cluster.
I then spent some time using shapely to draw a rough polygon around the galaxy, so that we can specify only clusters that are directly within the galaxy, as the cluster detection gets a little wonky beyond the galaxy itself.
I also went around and wrote down the positions of the main foreground stars within the set, and removed any clusters that were somewhat close to those objects, as their photometry would likely have been affected.
Identifying Brightest Few
I then identified within this subset the brightest JWST clusters, using the F150W band photometry. The resulting subset was centered near the core of the galaxy, and represented a diverse set of clusters, as the below SED’s demonstrate.
Creating SEDs
I then reused some of my existing code to create SEDs for each of these sources. This took a little more time than it probably should have, as I had initially designed the function to require and HST cluster position, and to not take no for an answer.
Luckily, by converting the JWST cluster position into an HST pixel position (using WCS), and allowing the function to return an empty row of HST photometry, I was able to retrofit the larger function to produce SEDs for JWST-Exclusive clusters.
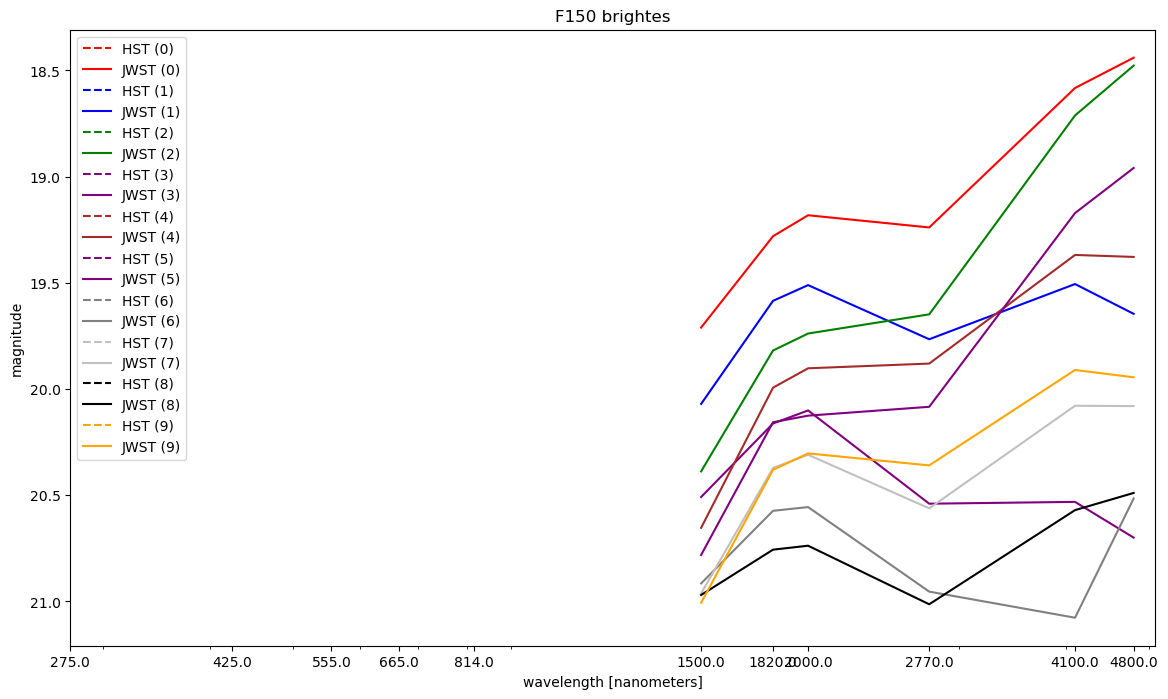 An SED depicting the 10 brightest JWST clusters that do not have an equivalent HST cluster.
The main thing that stood out to us about these SEDs was that they weren’t all characterstic of H-alpha emitting young clusters. Many had the appearance closer to an older/intermediate aged cluster, which is a very interesting result.
Future Work
For next week, we want to take a closer look at these very bright clusters that weren’t present in our HST set, and try to see if they do appear in the HST image.
We were also interesting in trying to implement our own photometry code on the HST images, using this new cluster set.